Get Started Free
Request a demo
Talk to a Data Pro
Request a demo
With OWOX Data Marts companies grow revenue as fast, as they collect new data by enabling self-service reporting for everyone.
OWOX brings live, trusted business data to your spreadsheets and BI tools and enables questions in plain English - and provides reliable answers & reports updates in real time.


From fast-scaling startups to global enterprises – OWOX platform powers decisions across every department with data people actually trust.


Tired of paying to collect your own data?
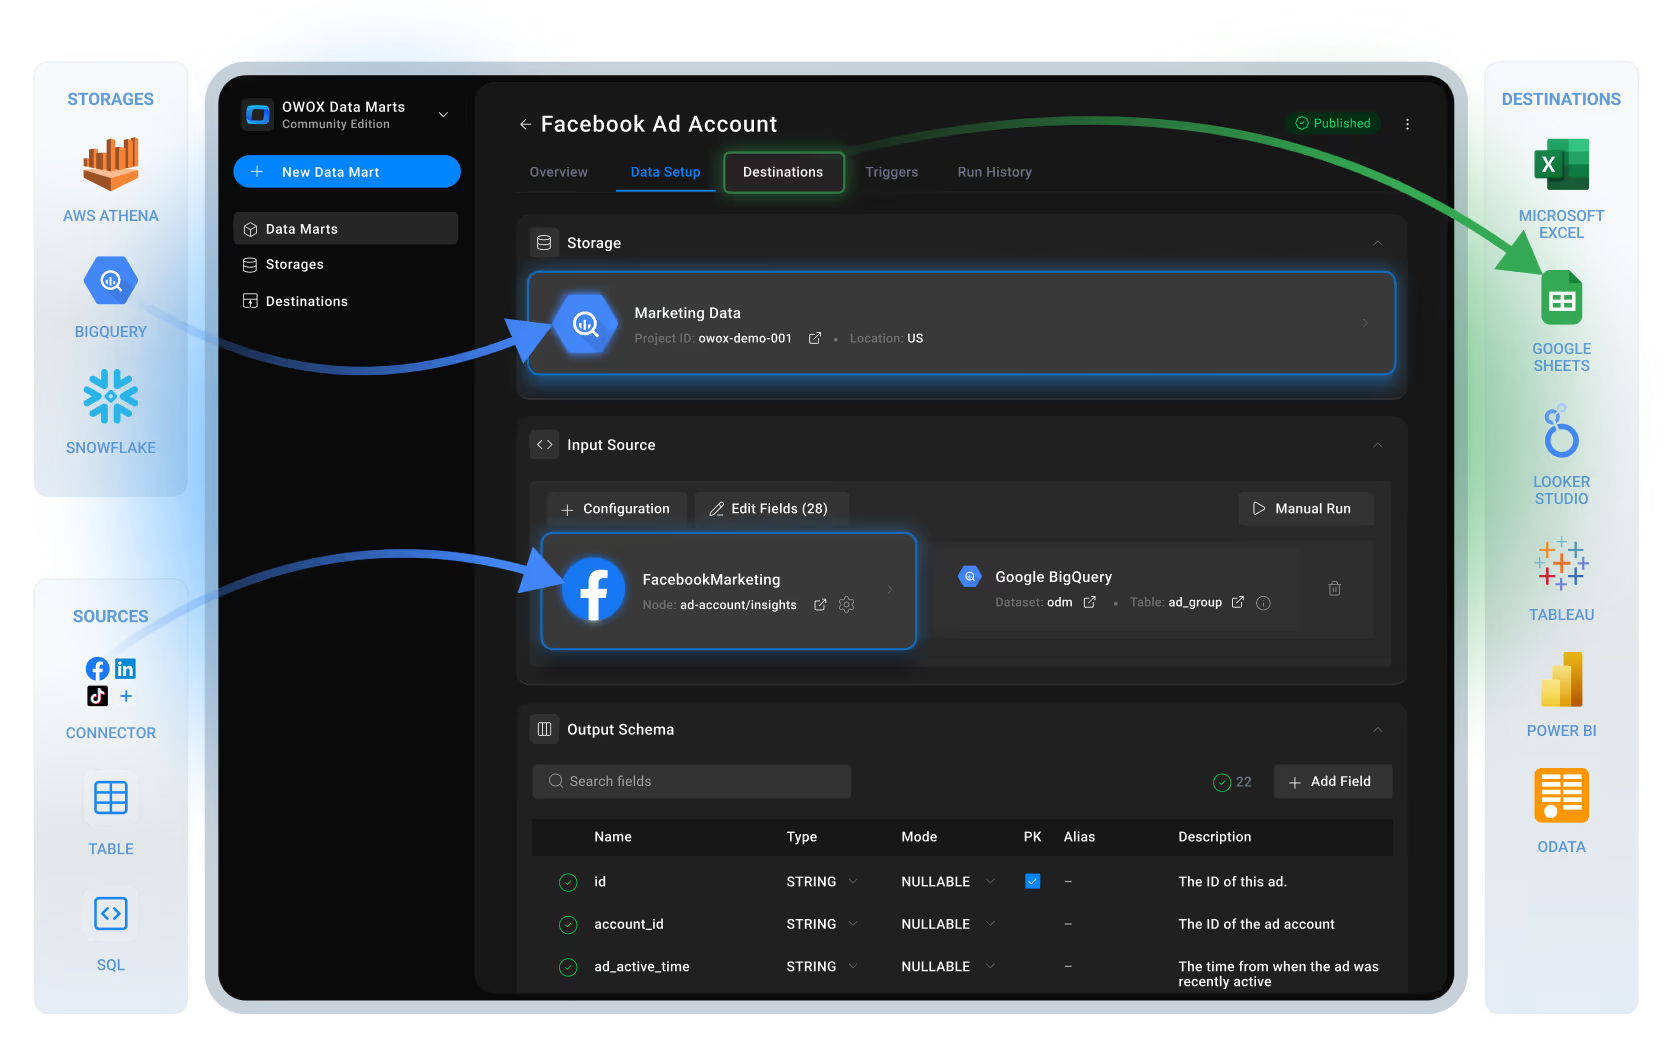
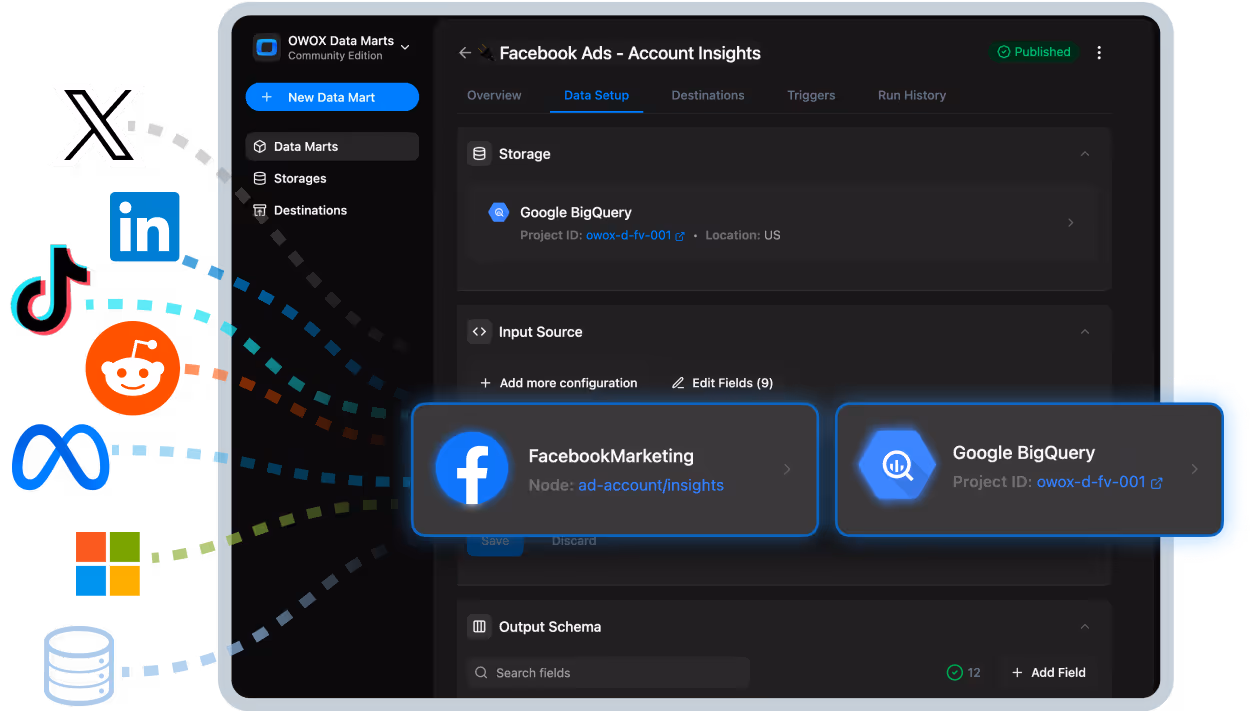
Pull data from any ads platform, CRM, or database straight into your warehouse – free, open-source, and fully under your control. No vendor lock-in, no per-row fees, no mystery magic.

Still parking your data in someone else’s black box?
Drop your data exactly where you want it – BigQuery, Athena, Snowflake, Sheets – and keep full control over structure, access, and retention. No lock-in, no shady middleman.

Dashboards are nice, but Sheets are where the real work gets done.
Pipe live, governed data straight into Google Sheets, set it to auto-refresh, and let teams build the reports they actually want – without bugging analysts or touching SQL

Still adding the same SQL to every dashboard?
Connect Looker Studio directly to governed OWOX Data Marts so you can define metrics once and reuse them everywhere. No duplicate logic, no broken joins – just clean, consistent dashboards that stay in sync. (and use the same data marts in spreadsheets)

Dashboards are beautiful, but there are no tools that are easier to use than Excel…
Pipe live, governed data from straight into Excel or Google Sheets, set delivery on autopilot, and let business teams get reports they actually want – without CSV files or SQL.

Still adding the same SQL to every dashboard?
Connect Power BI directly to governed OWOX Data Marts, where you define metrics once and reuse them across all teams & BI tools. Let all your dashboards show the same metric values & stay in sync.

Still rewriting the same SQL in five different tools?
Build once, reuse everywhere. Create governed, reusable data marts that feed Sheets, dashboards, and BI tools – all with versioning, docs, and full control.

Let your reports (and connectors) refresh themselves while you focus on work that matters.
Put data delivery on autopilot. Schedule updates for both reports & connectors – and keep dashboards fresh without manual babysitting or outdated data.

Tired of every team defining “revenue” differently?
End the metric chaos. Define KPIs once, lock in the logic, and reuse it everywhere – Sheets, dashboards, BI tools. No more mismatched numbers, no more “which report is right?” debates, just one source of truth your whole company can trust.

Drowning in disconnected tables?
Stop stitching reports together like a patchwork quilt. Define relationships once, connect your datasets like Lego, and give every tool – from Sheets to AI – a single, reusable model. Faster builds, cleaner joins, and no more “why doesn’t this match?” headaches.

Still waiting on analysts for simple answers?
Skip the ticket queue. Just ask your question in plain English and get charts, pivots, or KPIs straight from trusted, governed data – instantly. No SQL, no delays, no “I’ll get back to you.”

Tired of access chaos?
Add teammates, set permissions, and control who sees what – all from one place. Keep sensitive data safe, onboard faster, and ensure every user has the right access at the right time.

Share access by your rules
Grant access to data marts based on role, team, or business unit eg. marketing or sales. Always keep your data not only secure, but also relevant to each and every one.
OWOX BI started as a marketing analytics platform – now, OWOX Data Marts fuels fast decisions in finance, operations, and product teams too. We are here to ensure - you’ll get the answers you need – no SQL or IT bottlenecks. Check what's new in our сhangelog

.png)

Answer your questions in plain English - get answers based on your corporate data & a data model.
From idea to insight, OWOX gets you there faster – without relying on analysts.
Say goodbye to back-and-forths. Build pivots, charts, and reports that stay updated – all on your terms.
Your reports are always built on the company’s verified logic and up-to-date metrics.

"OWOX Data Marts helped transform our data team from reactive executors to strategic enablers. We no longer drown in reporting requests – now, marketing, sales, and finance teams build the reports they need on their own, while analysts focus on high-impact decisions."
Alex, Head of Analytics for Ecommerce

See the same reliable metrics across every report, dashboard, or spreadsheet.

Explore clean, business-ready data without worrying about formulas or filters.

Pull trusted reports into spreadsheets you already know. Create pivots, and charts.

Ask business questions in plain English. Get answers instantly – no analyst required.

Your Google Sheets just leveled up.
Turn data into clear charts and tables automatically, no setup needed.

Ask questions like “How did revenue trend by product last quarter?” and see clear results – with explanations you can trust.

Built once → used in 81 reports across organizations

Built once → used in 81 reports across organizations
.svg)
Built once → used in 81 reports across organizations
1SELECT
2category,
3SUM(revenue)
4FROM sales_data
5WHERE country = 'US'
6AND year = '2025'
7GROUP BY category
8With OWOX Data Marts, data teams create reusable data marts and trusted metrics - so they stay in full control, while business users explore and report on data confidently – without constant requests or broken dashboards.


From fast-scaling startups to global enterprises – OWOX powers decisions across every department with data people actually trust.


Tired of paying to collect your own data?
Pull data from any ads platform, CRM, or database straight into your warehouse – free, open-source, and fully under your control. No vendor lock-in, no per-row fees, no mystery magic.
Still parking your data in someone else’s black box?
Drop your data exactly where you want it – BigQuery, Athena, Snowflake, Sheets – and keep full control over structure, access, and retention. No lock-in, no shady middleman.
Dashboards are nice, but Sheets are where the real work gets done.
Pipe live, governed data straight into Google Sheets, set it to auto-refresh, and let teams build the reports they actually want – without bugging analysts or touching SQL
Still adding the same SQL to every dashboard?
Connect Looker Studio directly to governed OWOX Data Marts so you can define metrics once and reuse them everywhere. No duplicate logic, no broken joins – just clean, consistent dashboards that stay in sync. (and use the same data marts in spreadsheets)
Dashboards are beautiful, but there are no tools that are easier to use than Excel…
Pipe live, governed data from straight into Excel or Google Sheets, set delivery on autopilot, and let business teams get reports they actually want – without CSV files or SQL.
Still adding the same SQL to every dashboard?
Connect Power BI directly to governed OWOX Data Marts, where you define metrics once and reuse them across all teams & BI tools. Let all your dashboards show the same metric values & stay in sync.
Still rewriting the same SQL in five different tools?
Build once, reuse everywhere. Create governed, reusable data marts that feed Sheets, dashboards, and BI tools – all with versioning, docs, and full control.
Let your reports (and connectors) refresh themselves while you focus on work that matters.
Put data delivery on autopilot. Schedule updates for both reports & connectors – and keep dashboards fresh without manual babysitting or outdated data.
Tired of every team defining “revenue” differently?
End the metric chaos. Define KPIs once, lock in the logic, and reuse it everywhere – Sheets, dashboards, BI tools. No more mismatched numbers, no more “which report is right?” debates, just one source of truth your whole company can trust.
Drowning in disconnected tables?
Stop stitching reports together like a patchwork quilt. Define relationships once, connect your datasets like Lego, and give every tool – from Sheets to AI – a single, reusable model. Faster builds, cleaner joins, and no more “why doesn’t this match?” headaches.
Still waiting on analysts for simple answers?
Skip the ticket queue. Just ask your question in plain English and get charts, pivots, or KPIs straight from trusted, governed data – instantly. No SQL, no delays, no “I’ll get back to you.”
Tired of access chaos?
Add teammates, set permissions, and control who sees what – all from one place. Keep sensitive data safe, onboard faster, and ensure every user has the right access at the right time.
Share access by your rules
Grant access to data marts based on role, team, or business unit eg. marketing or sales. Always keep your data not only secure, but also relevant to each and every one.
OWOX BI was born for marketing analytics. Today, OWOX Data Marts powers the full stack for businesses – from data connectivity & enablement to semantic layer with reusable metrics and business-wide reporting.
And with new features shipped, you’ll never hit a ceiling. Check what's new in our сhangelog
Go beyond building ad hoc reports. Design, document, and govern a data model your entire org can trust — once and for everyone.
Deliver the same verified data marts to Google Sheets, Looker Studio, or dashboards — without duplicating SQL.
Update business logic once, and every connected report reflects the update instantly — no manual work required.
Spend less time fixing filters, more time solving real business problems.
"OWOX Data Marts helped transform our data team from reactive executors to strategic enablers. We no longer drown in reporting requests – now, marketing, sales, and finance teams build the reports they need on their own, while analysts focus on high-impact decisions."
Alex, Head of Analytics for Ecommerce
One metric. One definition. Everywhere.
Standardize KPIs and business terms so everyone speaks the same data language.
Build once. Trust always.
Model business logic using SQL, define metrics and joins once, and reuse them across every department and report.
The familiar UI meets corporate trusted data. Pull live, version-controlled data into spreadsheets. Filter, sort, and visualize in seconds.
From “Submit a request” to “I got it.”
Let stakeholders build and tweak their reports using a natural-language interface — no SQL, no delays.
Your Google Sheets just leveled up.
Auto-generate charts, graphs, and pivot tables from any dataset — directly inside Sheets, no setup required.
Need SQL help? Just ask.
Ask questions and get results with traceable logic. The only Copilot that explains how and why.
Built once → used in 81 reports across organizations
1SELECT
2category,
3SUM(revenue)
4FROM sales_data
5WHERE country = 'US'
6AND year = '2025'
7GROUP BY category
8Built once → used in 81 reports across organizations
Built once → used in 81 reports across organizations


Only the right people see the right data. Share specific metrics, data marts, or data model contexts with confidence.
All data stays in your environment. No black boxes, no vendor lock-in, no loss of control.
Every number has a source. Business users understand the logic — analysts manage it centrally.
Build once, trust always. Reports stay connected to the data model and reflect changes instantly.


Why automate when you can manually create the same report 12 times?

Nothing builds cross-functional trust like three reports with different revenue totals.

If you can’t explain it, it must be important, right?

Why fix the foundation when you can just add another SQL on top?


We're building open-source data connectors, enabling every team to import data into spreadsheets or data warehouses without relying on third-party solutions
Your credentials never shared with third-party services.
Adjust data schemas and fetch schedules as you need.
Setup all pipelines directly in Google Sheets using Apps Script.
Collaborate with others: contributing to existing integrations or creating new ones.
Our connectors are free under the ELv2 license for internal use or for offering paid services.
Join our community to collaborate, customize, and innovate together
Set up your imports by copying our Google Sheets template for available integrations and customize as needed—no coding skills required.
Create new connectors using Apps Script (or improve existing). Follow our detailed instructions in the Contributor’s Guide and share your innovations with the community.

If 165,000+ users and 10+ years of analytics expertise haven’t convinced you yet, maybe these classic marketing moves will.

OWOX Data Marts is a web platform. You won’t need a CD, USB, or a time machine. But you will need better answers to business questions.
Hurry: 1,275 data teams signed up this week. Act now before the price goes up, and finally stop arguing over “what’s the real revenue number.”
You can also talk to a data expert (we promise they’re nice)


